Project Outline
Abstract
As Netflix blog puts it, imagine “unleashing a wild monkey with a weapon in your data center (or cloud region) to randomly shoot down instances and chew through cables”. If they could handle such random anomalies during the workday without customer impact, they could be much more confident that their procedures would work.
A vast array of challenges arise when attempting to build a software service at scale. Users may access the service from all over the world, and should see small latencies no matter their location. Data centers or web endpoints may go down unexpectedly, but traffic must flow. High traffic from individual users should not impact other users. And when something goes wrong (and it will), monitoring and alerting will be in place to be able to detect the problem and recover as quickly as possible.
In order to maintain high availability (measured in percentages, such as 99.9999%, with as many “9s” as possible), we will incorporate automated failure handling into their regular workflows with products such as Chaos Monkey. Instead of hoping the engineering was done right the first time, We will deliberately trigger failures to practice recovering from them and further improve their tooling to automatically handle such failures or send alerts when manual intervention is needed with the aid of status pages made available to the customers.
Problem: We cannot assume that cloud services will always work all of the time. It’s much better to practice handling failures in a safe environment rather than when you least expect it.
Goal: We aim to achieve graceful degradation, where the system continues to function under stress without crashing. Real-time monitoring of system performance and error rates helps determine whether the system self-heals or requires intervention.
Background
Our chess game service creates an environment where users can play a single move and after they have made the move, they are given a new game. The goal of the user is to make the best possible move given the board state. Here is a demo of how to play the game:
The game architecture and structure consists of several components designed to handle user requests, allocate chess boards based on other user's current game states and compute optimal moves.
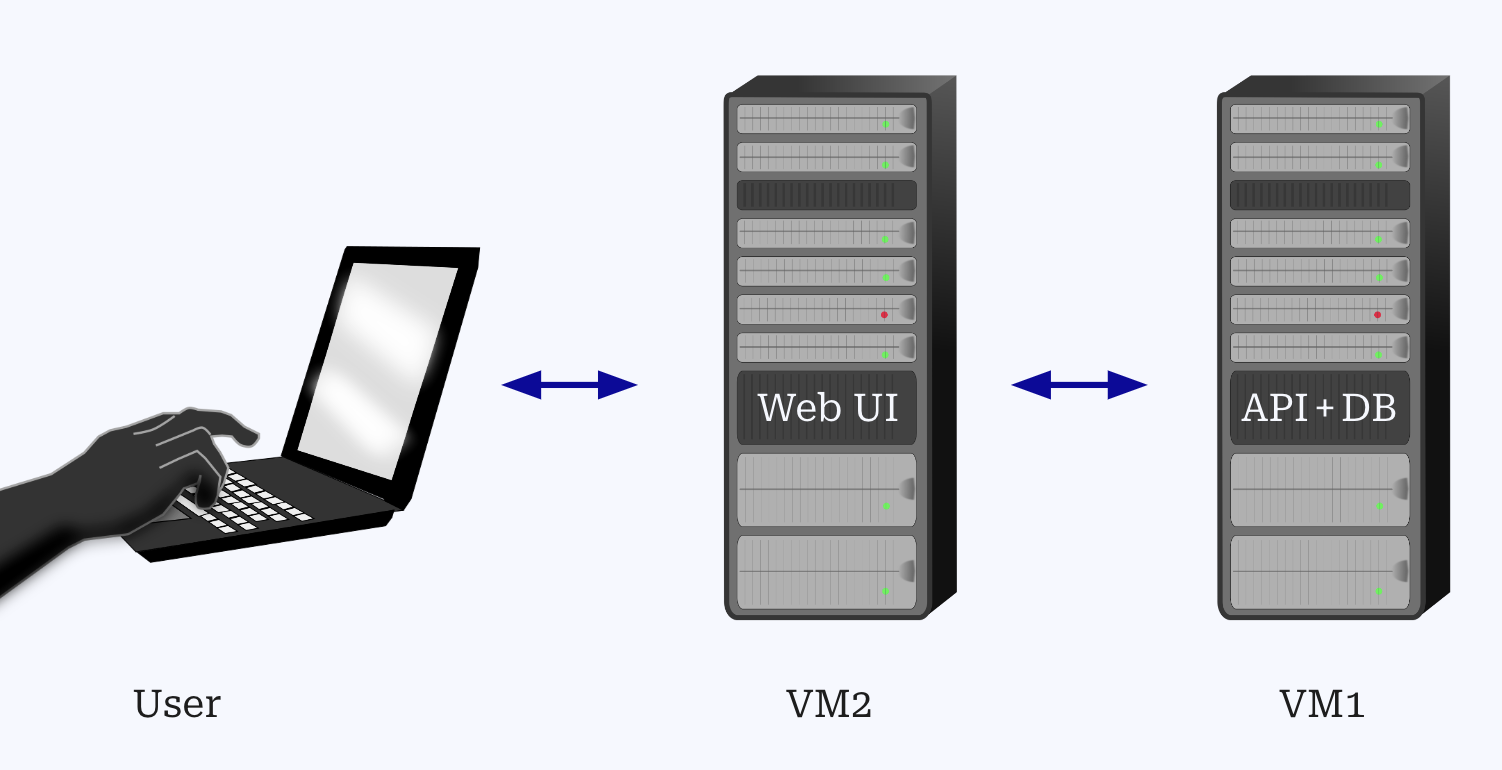
The service architecture consists of:
- Web UI (VM2) for user interaction.
- API (VM1) for handling game logic, authentication, and board management.
- Database (VM1) that stores game data, including moves, notifications, board states, and user accounts.
- VM1 and VM2 are hosted on Ubuntu 24.04 instances with 1 vCPU and 1 GB RAM.
To ensure this architecture is scalable, robust and capable of handling unexpected disruptions, we are applying chaos engineering principles. The chaos engineering process allows us to identify potential weak points in our system by deliberately introducing failures in a controlled and documented manner.
In order to maintain high availability (measured in percentages, such as 99.9999%, with as many “9s” as possible), we will incorporate automated failure handling into their regular workflows with products such as Chaos Monkey. Instead of hoping the engineering was done right the first time, We will deliberately trigger failures to practice recovering from them and further improve their tooling to automatically handle such failures or send alerts when manual intervention is needed with the aid of status pages made available to the customers.
Definitions
Status Page
- External Monitoring: The assessment of a web service's performance and availability.
- Incidents: Disruptions affecting a web service's normal operation.
- Failures: Instances where a web service fails to operate normally due to errors or outages.
- Downtime: Duration of a web service is unavailable, due to planned maintenance or unexpected issues.
- Real-time: Immediate updates about service status as events occur.
- Healthy: The web service functions normally, with no issues or failures reported.
- Availability: Whether or not a service can be accessed and utilized by a user.
Database Sharding
- Shards: A smaller part or fragment of a larger database that operates independently. Multiple shards together represent the entire dataset.
- Scalability: The ability of a system to handle growing amounts of data or traffic.
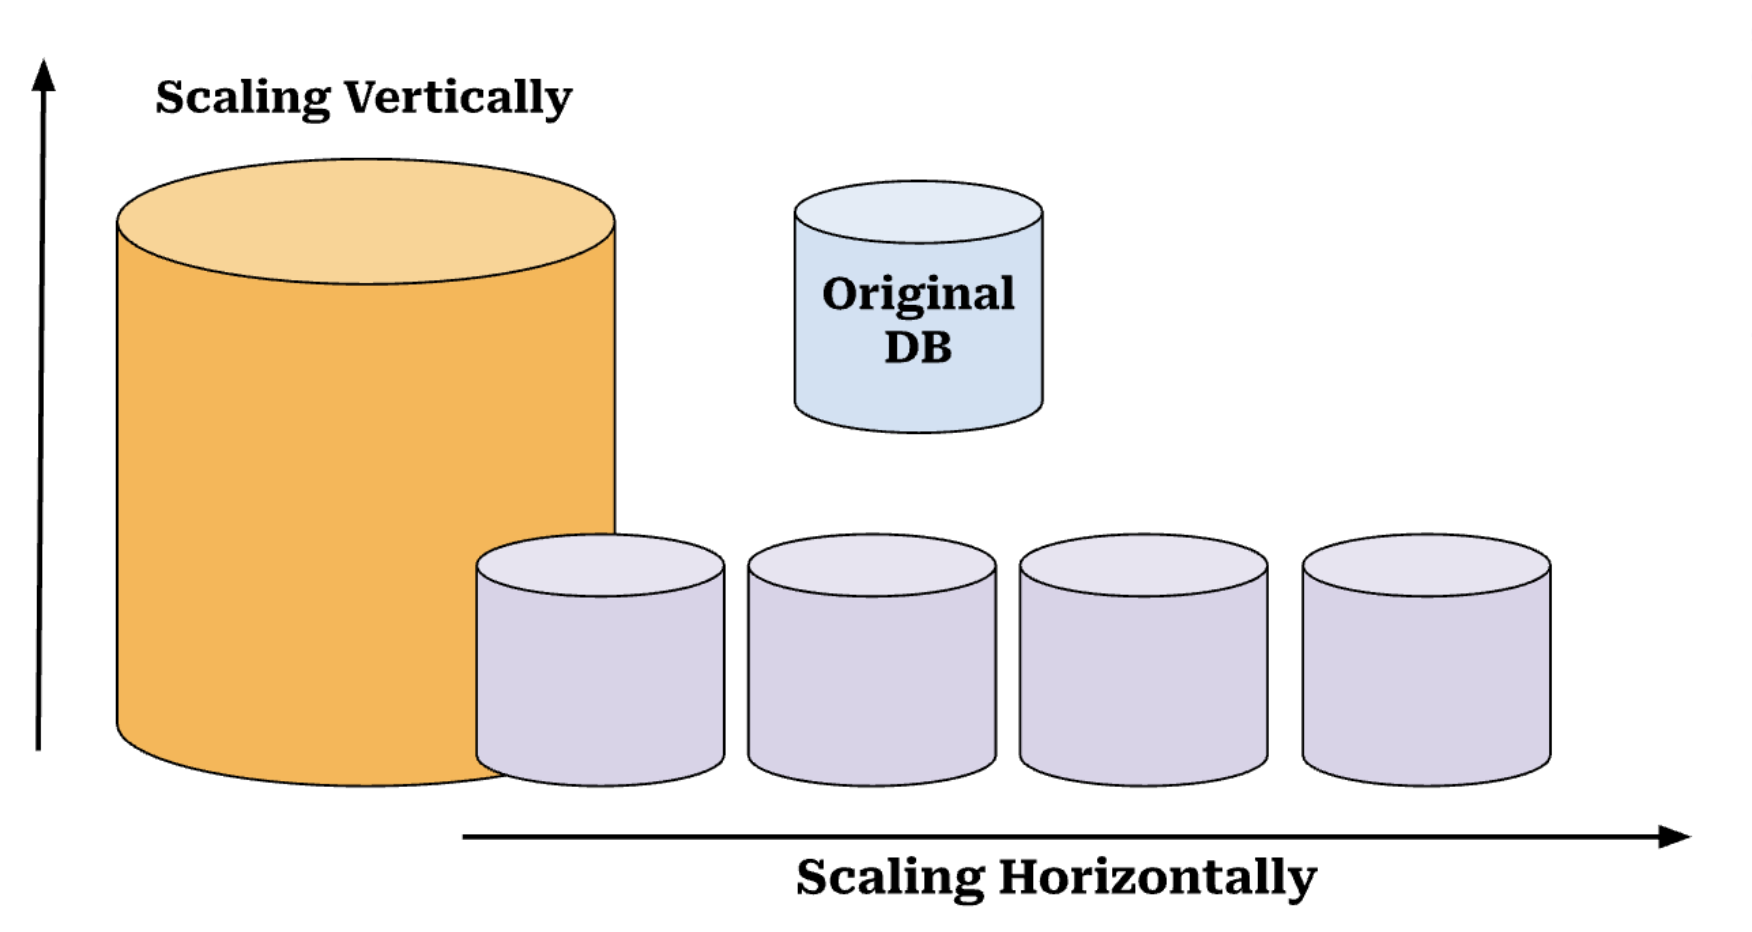
- Vertical Scaling: Increasing the capacity of a single server or machine by upgrading its hardware (e.g., adding more RAM or a faster CPU) to handle more data or traffic.
- Horizontal Scaling: Increasing the capacity of a system by adding more servers or machines to distribute the load. Sharding is an example of horizontal scaling.
- Hot Spots: A situation where certain shards become overloaded because data is unevenly distributed. This can lead to performance issues if one shard receives a disproportionate number of queries or data.
- Hash Function: A function that converts input data (such as user ID) into a fixed-size value that determines which shard the data will be stored in.
- Latency: The delay between a user action (such as a query) and the system's response. Reducing latency improves the speed at which users can access data.
Throttling and Rate Limiting
- Infrastructure as a service (IaaS): a pay as you go cloud service that buyers can use, largely for computing, storage, and networking.
- Throttling: when requests are intentionally delayed so that they are more spread out over time, decreasing load on servers.
- Rate Limiting: preventing abuse and ensuring equitable access to resources by putting a hard cap on the number of requests a user can make within a certain period of time.
- Over-provision: when more than enough infrastructure is bought to meet users’ requests, leading to resource wastage.
- Under-provision: when not enough infrastructure is available to meet users’ requests, leading to poor performance.
Load Testing
- Bottlenecks: points in the system where performance slows down or fails, usually due to limited capacities or inefficiencies.
- Throughput: the amount of data processed by the system within a specific time period, often used as a performance metric.
- Virtual Users: In load testing, the simulated users that mimic real users on the system in order to test the systems capacity.
- Telemetry: the automated collection and transmission of data from remote sources for monitoring and analysis.
- Azure Monitor: a service from Azure that helps monitor the the performance of applications and infrastructure of the system.
- ARM templates: Azure Resource Manager templates used to define the resources needed for a system.
Fault Injection
- Hardware Fault: A fault simulating a type of hardware failure or malfunction (loss of power, electrical surge, etc).
- Software Fault: A fault simulating a type of software failure malfunction (call stack error, race condition, systemd/server software failure, etc.)
User Stories
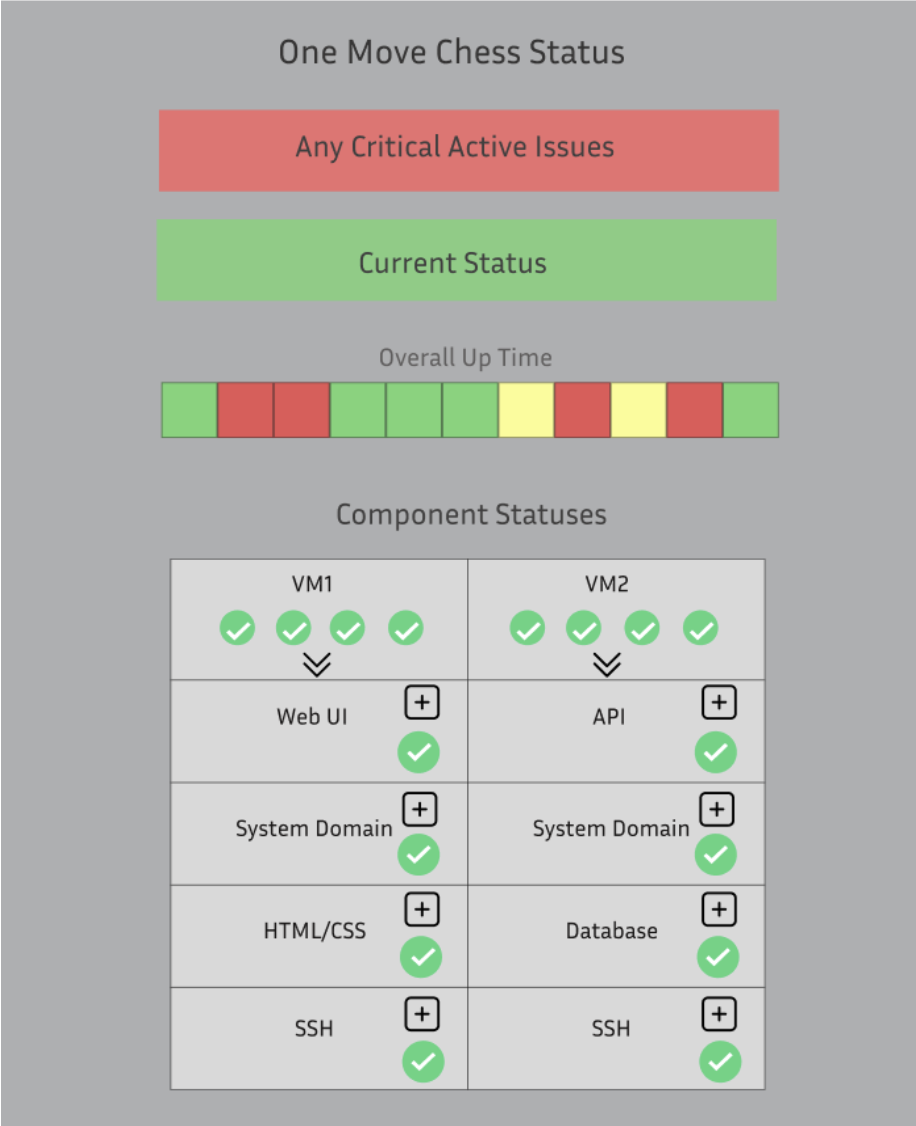
Something in our database goes down causing our downtime for our web service. Our developers are immediately notified that the web service is down, and they refer to the status page to see what specifically is wrong. They see the red visual indicator on the database section, so they proceed to click the “+” symbol on the DB section. They can find the exact error causing the issue and come up with possible solutions to fix it promptly.
Imagine you're a developer for One Move Chess. People are really enjoying playing the game and it starts to grow globally, millions of users start logging in simultaneously to make their move. Each game, with its unique state and user data, is stored in a central database, but the growing number of users begins to overload the system. Database queries to retrieve game states, validate moves, and update the board slow down, especially during peak hours when many users are trying to make their moves concurrently. To handle the load, you decide to implement database sharding. You shard the database by username, distributing different games across multiple servers. This ensures that when a user makes a move, the query only affects the specific shard containing that game’s state, significantly reducing the load on each individual server. The result is a smooth, lag-free experience, where users can quickly make their move, and pass the game along, even during high-traffic periods. Database sharding allows OneMove Chess to handle many players while keeping performance intact.
Using load testing tools, we simulate high traffic onto the server. This stress on the server causes the machine hosting the API to crash. Once the status page notices that it cannot reach the API, it marks it as “down.” A developer is then notified that the API is down, and the developer can go in and see exactly what crashed within the status page and solve the issue promptly.
Chaos Engineering Steps
- Hypothesis: We identify potential problem statements.
- Experiment: We introduce failures to test the hypothesis. We will disable key components such as the production environment to induce failure and observe the consequences.
- Evaluation: We assess the internal and external impact of these disruptions, determining what was affected and how the system responded.
- Solution: Based on the results, we fine-tune the system to improve failure handling, automation, and scalability.
Design and Content
Status Page
Objective: Provide timely updates about the performance and availability of the One Move Chess web service.
How will this help us?
- Incident Management: We identify potential problem statements.
- Scalability & Productivity: We introduce failures to test the hypothesis. We will disable key components such as the production environment to induce failure and observe the consequences.
- Chaos Engineering: External monitoring and bug detection are essential to chaos engineering. Ensuring that our software is in a good and healthy state before launching our chaos monkeys to break everything is critical to chaos engineering. A status page will allow us to define our ability to account for any unplanned disruptions and incidents.
Necessary Components of Our Status Page:
- Current System Status: Implement an intuitive label or visual indicator to show us the current status of our web services. This needs to be easy and clear to read at a glance.
- Incident History and Response Time: Integrate analytics to display historical performance metrics of our web services. This will help assess our scalability improvements over time, highlighting response times and incident frequency trends.
- Hosted on a separate server: Ensure the status page is hosted on a dedicated server, allowing continuous access at all times.
- Real-Time Updates: Ensure that the status page updates in real time when an incident occurs, providing immediate visibility to developers.
- Monitoring and Alerts: Develop a system to automatically notify our team via email when the status page indicates an error that could lead to service downtime.
How will we implement this page:
- GitHub Repos Exploration: 100s of companies with examples of their open source code for status pages are available for free. We plan to leverage some of these examples and incorporate their ideas on our status page. Repo: https://github.com/ivbeg/awesome-status-pages.
- Integration of Existing Tools: Another approach that we are interested in exploring is rather than developing our own status page, we can look into incorporating an existing tool to monitor our web services. For instance, Gremlin is a tool that specializes in chaos engineering and service monitoring.
Below is the mock-ups of the design for our status page.
Database Sharding
Database Sharding is a technique that involves splitting a large database into smaller, more manageable pieces (which are called shards). Each shard operates independently but together forms the complete dataset.
Why do we want to incorporate Database Sharding?
- Scalability: One of the primary reasons for sharding is scalability. As data grows, you can either scale vertically or scale horizontally. Scaling vertically is adding more resources to a single database. Instead, database sharding is scaling horizontally to distribute the load across multiple servers, making it possible to handle the large dataset.
- Cost-Effectiveness: Rather than scaling vertically (upgrading to a bigger and more expensive server), sharding allows you to scale horizontally by adding more servers as your dataset grows, which is typically more cost-effective.
- Performance: Sharding improves database performance because each shard can be queried independently. Instead of querying one massive table, you’re only querying a smaller subset of the data, which reduces query time.
- Fault Tolerance: Sharding also offers a level of fault tolerance. If one shard goes down, the others can continue operating, ensuring that your entire system isn’t compromised by a single failure.
How is Database Sharding Implemented?
- Range-Based Sharding: This method involves dividing the data based on a range of values. For example, we could use a column like user ID. Users with IDs 1-10,000 go to shard 1, and users 10,001-20,000 go to shard 2, etc. The benefit to Range-Based Sharding is that it is very simple to implement. However, a potential problem with Range-Based Sharding is that it can lead to hot spots, where certain shards become overloaded if the data isn't distributed evenly.
- Hash-Based Sharding: In this approach, a hash function is applied to a key (such as a user ID) to determine which shard the data should be stored in. The hash function distributes users evenly across all shards, helping to prevent any single shard from becoming a hot spot. For our purposes, this approach works well. However, issues can arise when scaling to a very large system, particularly when adding new shards, as data would need to be rehashed and redistributed.
- Geographic Sharding: This strategy involves dividing data based on geographic location. For instance, users from North America can be placed in one shard, while users from Europe go into another, and users from Asia in a third shard, etc. This method can optimize performance for globally distributed applications by reducing latency and improving data locality. For our purposes, we could test this by using a VPN to simulate different regions and recording timestamps before and after connection to identify if certain regions experience slower performance.
The database is a critical component to our software, and we need a systematic way to scale it as the project grows. Additionally, when we intentionally take down sections of our software, we want to ensure that a single failure does not compromise the entire database, maintaining the system's overall stability and availability. Therefore, Database Sharding is a cost-effective solution to these problems.
Throttling/Rate Limiting
What’s the issue?
- When scaling via purchasing IaaS(as we are in our comps), there is a need to balance performance and resources used(i.e. money spent).
- Under-provisioning causes poor performance and thus a poor experience for the user.
- Over-provisioning causes resource wastage.
- It is very hard to predict what the maximum rate of traffic a site will ever receive. And trying to figure that out is a witch hunt. The reality is that despite the best balancing of under and over-provisioning, an important aspect of scaling is dealing with relatively short, high bursts of traffic and requests that are above the current capabilities of our infrastructure.
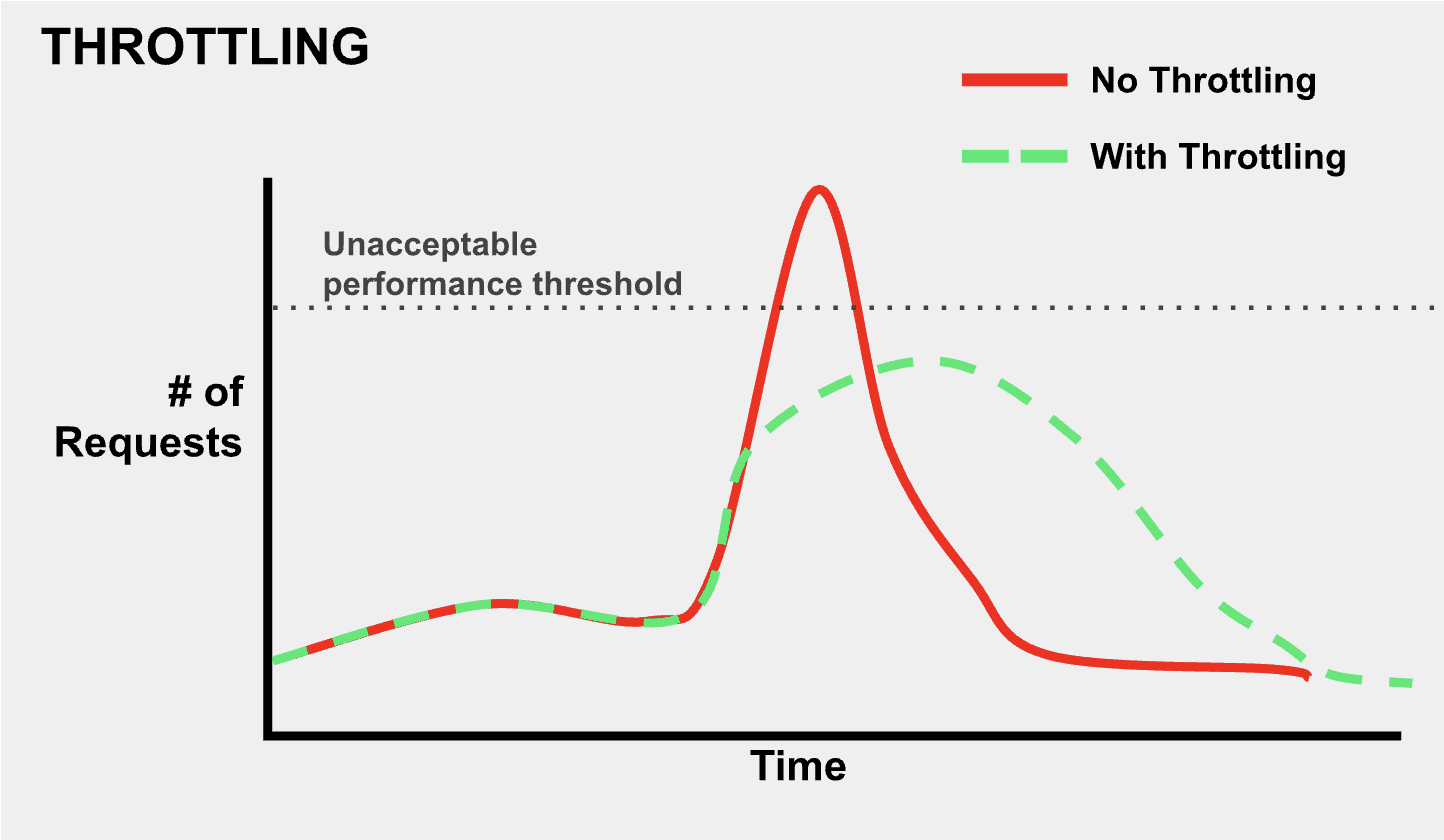
What is throttling?
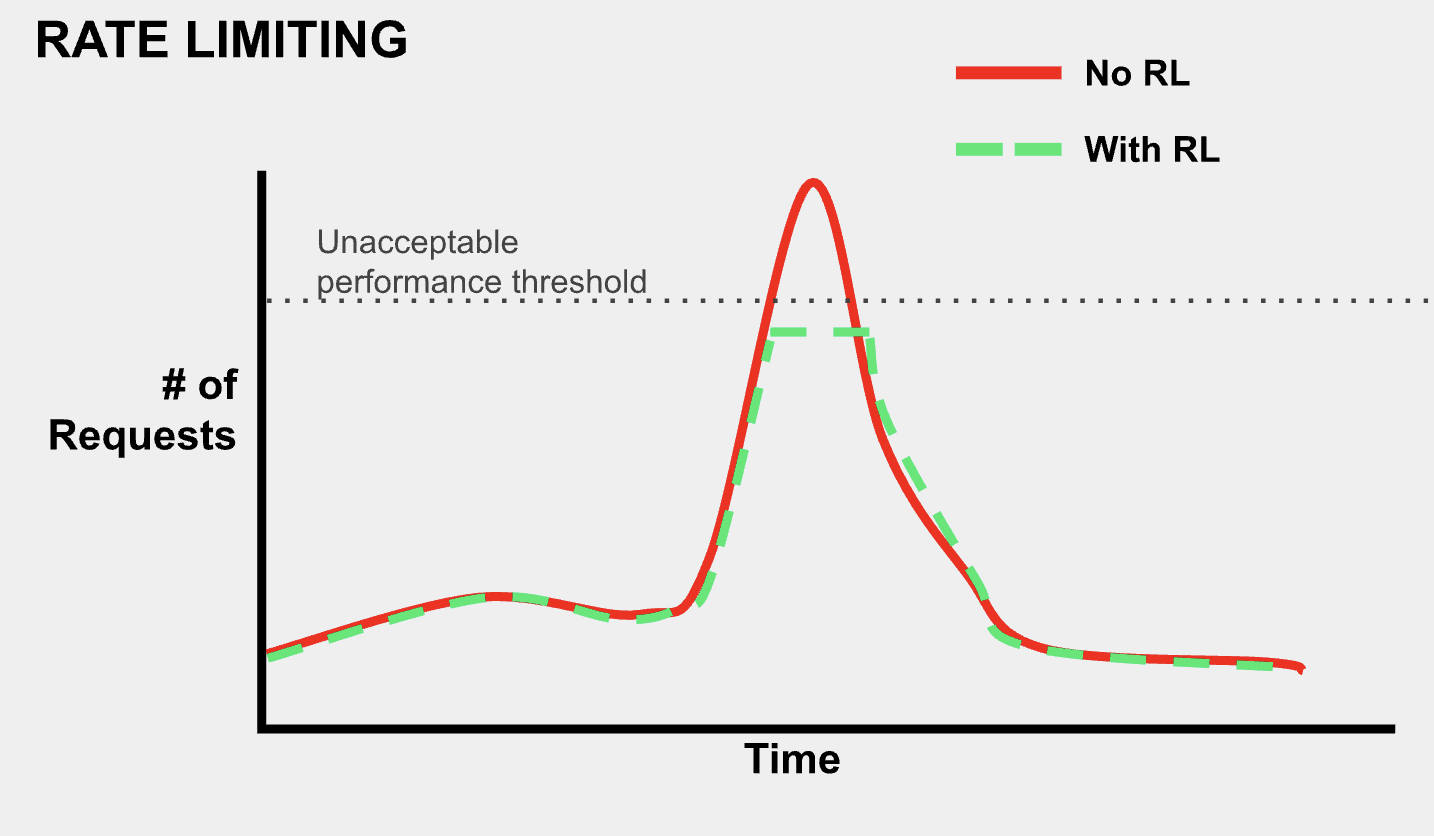
- Throttling is when requests are intentionally delayed so that they are more spread out over time. Ideally, this keeps requests below a level(indicated by the gray dotted line labeled “Unacceptable performance threshold) where users do not want to use the site or worse, the server crashes.
What is rate limiting?
- Rate limiting is putting a hard cap on the number of requests a user can make within a certain period of time.
Throttling vs Rate Limiting
- Throttling does not intentionally drop requests from users. In that sense, it is less severe of an action than rate limiting, which after a certain point blocks any requests.
- Rate Limiting protects against bots, DOS, and DDOS attacks.
- Implementing throttling alone does not ensure that traffic will never crash our infrastructure. The nature of rate limiting and its hard cut off gives a more confident solution to preventing extremely large, unmanageable amounts of traffic.
How would our project implement this?
- Broadly, a combination of throttling and rate limiting is the goal. Throttling would be the initial response to any spike in traffic that stresses our servers, but request rates that are above a specified range(which will be experimentally determined) will be rate limited.
- We would track the number of requests based on IP and rate limit if the number of requests goes past a human-reachable limit.
- There are a number ways to strategize the specific types of requests that get throttled and rate limited that would need to be automated. Our main strategy will initially be based on simple, manual stress testing of our servers.
- Although not directly the mechanism of throttling and rate limiting, some sort of internal autonomous diagnosing/monitoring tool will be set up. (This tool will also eventually be used give information to the status page)
Load Testing
What is load testing?
- It examines how a system performs during normal and high loads and determines if a system, piece of software, or computing device can handle high loads given a high demand of users.
Why is it useful?
- Discovering bottlenecks before deployment: Load testing identifies performance constraints under heavy usage, allowing issues to be addressed before the system goes live.
- Enhances the scalability of the system: It helps determine how well the system can handle increased user loads, ensuring it can scale effectively as demand grows.
- Reduces the risk of downtime in a system: By simulating high traffic, load testing reveals potential failures, minimizing unexpected outages in production.
- Improved user experience: It ensures that the system remains responsive and performs well under stress, providing a smooth experience for users.
- Reduced failure cost: Catching performance issues early through load testing prevents costly fixes and losses associated with system crashes or slowdowns in production.
How could we implement it into our comps?
- Performing Load Testing on Our Own:
- Manual Load Testing: For a smaller scale, we can manually stress the system by simulating high traffic through concurrent browser sessions, APIs, or scripts. This approach requires less tooling but is limited in scalability.
- Custom Load Testing Approach:
- Python-Based Load Testing: Instead of using Azure’s built-in tools, we developed a custom multi-threaded load testing script that allowed us to simulate high traffic and assess system performance in a controlled environment. This approach provided flexibility in adjusting user load dynamically.
- Benefits: Greater control over test parameters, cost-effective implementation, and the ability to isolate bot traffic from real players to maintain user experience.
- Implementation: Our script simulated various levels of user activity, allowing us to dynamically adjust the number of users, bots, and moves per test. This approach enabled us to analyze performance at different load levels without interfering with real player interactions.
- Performance Tracking & Logging: Instead of relying on Azure Monitor, we implemented custom logging to track response times, request failures, and system load directly in our console. This allowed us to monitor real-time system performance and make targeted optimizations.
- Benefits: Direct insight into API performance, reduced dependency on cloud monitoring tools, and the ability to fine-tune system behavior based on observed performance trends.
Fault Injection
What is fault injection?
- In software testing, fault injection is a technique for improving the coverage of a test by introducing faults to test code paths; in particular error handling code paths that might otherwise rarely be followed.
- Essentially, it is the practice of intentionally introducing (injecting) bugs, glitches, or other failures (faults) into a piece of software or web application.
- Fault injection can be manual or automated, and can focus on software faults (unusual situations within the context of the code itself) or hardware faults (unusual situations within the context of the hardware that the software is running on).
- Hardware faults are harder to implement without direct hardware access, but their results can be simulated fairly effectively via specially-designed software faults designed to simulate loss of/damage to hardware without actually damaging the hardware in question.
Why perform fault injection?
- Improved reliability/testing capabilities: Fault injection allows testing of issues with code by introducing situations that would be difficult to produce organically under normal operation of the software.
- Testing without user reporting: Standard bug reporting requires user action and response for each bug found - fault injection gives the programmer the ability to create, test, and resolve bugs.
Determining faults to inject:
- Software and hardware faults commonly-found in other pieces of software or hardware can be injected.
- An innovative approach called iBiR: Bug-report-driven Fault Injection proposes parsing bug reports to determine faults to inject. This does require bug reports.
Implementation into our Comps:
- The “Chaos Monkey” part of the project will inject software faults into our web application OneMoveChess and the software running on the VMs, and simulate hardware faults on VM1 and VM2, or other hardware that we run the code on.
Conclusion
At the end of this project, our goal is to deliver a demo or video that clearly demonstrates how our changes have improved the scalability and resilience of our software. We'll show a before and after comparison using bots to simulate traffic, first with throttling off to observe the strain on the system, and then with throttling on to highlight how the system maintains performance under high demand. We'll also demonstrate how our system handles high query loads effectively through database sharding, ensuring fast response times even with increased traffic. Lastly, we'll introduce fault injection—such as turning off a VM in Azure or modifying the database—to illustrate how our software fails gracefully. Through all of these examples, we will demonstrate how our status page correctly identifies issues and provides visibility into the system's behavior. This demo will show how our additions allow the software to perform efficiently and remain resilient under real-world conditions.
References
Status Page
Instatus, “Our 10 Step Guide on How to Create an Internal Status Page.” https://instatus.com/blog/internal-status-page-guide
Hostko Blog, “Ultimate Guide to Status Pages.” https://www.hostko.com/blog/network/the-ultimate-guide-to-status-pages-benefits-tools-and-best-practices/#:~
Gremlin, “Announcing Status Checks to ensure safe chaos engineering scenarios.” https://www.gremlin.com/blog/announcing-status-checks-to-ensure-safe-chaos-engineering-scenarios
Database Sharding
Amazon Web Services, Inc. “What Is Sharding? - Database Sharding Explained - AWS.” Accessed October 4, 2024. https://aws.amazon.com/what-is/database-sharding/
RobBagby. “Sharding Pattern - Azure Architecture Center.” Accessed October 4, 2024. https://learn.microsoft.com/en-us/azure/architecture/patterns/sharding
“Understanding Database Sharding | DigitalOcean.” Accessed October 4, 2024. https://www.digitalocean.com/community/tutorials/understanding-database-sharding
Throttling/Rate Limiting
Elijah Asaolu. 2024. Rate limiting vs. throttling and other API traffic management. LogRocket Blog. Retrieved October 18, 2024 from https://blog.logrocket.com/advanced-guide-rate-limiting-api-traffic-management/
dlepow. 2023. Advanced request throttling with Azure API Management. Retrieved October 18, 2024 from https://learn.microsoft.com/en-us/azure/api-management/api-management-sample-flexible-throttling
mumian. 2024. Request limits and throttling - Azure Resource Manager. Retrieved October 18, 2024 from https://learn.microsoft.com/en-us/azure/azure-resource-manager/management/request-limits-and-throttling
Fault Injection
Fault injection - Wikipedia, https://en.wikipedia.org/wiki/Fault_injection
Ahmed Khanfir, Anil Koyuncu, Mike Papadakis, Maxime Cordy, Tegawende F. Bissyandé, Jacques Klein, and Yves Le Traon. 2023. iBiR: Bug-report-driven Fault Injection. ACM Trans. Softw. Eng. Methodol. 32, 2 (March 2023), 33:1-33:31. https://doi.org/10.1145/3542946
Load Testing
“Performance Testing vs. Load Testing vs. Stress Testing” https://www.blazemeter.com/blog/performance-testing-vs-load-testing-vs-stress-testing#:~:text=Load%20testing%20is%20a%20type,systems%20handle%20expected%20load%20volumes
“What is Azure Load Testing?” https://learn.microsoft.com/en-us/azure/load-testing/overview-what-is-azure-load-testing