Algorithm Performance
Of course, we needed to test the actual quality of predictions that our algorithms made.
Testing Methodology
We tested our algorithms by removing portions of the dataset then trying to predict what the users would have rated the removed items. This is a simple test which allows us to see how far off our predictions are from the actual rating the user gave.
In order to rate the amount of error from the actual predictions, we used the root mean squared error (RMSE) metric. It can be thought of as a weight average error, emphasizing large errors and promoting small ones. It was useful to us for three reasons - first, it is a simple, one number measurement of success. Second, its emphasis on large errors was helpful in tracking down how far off we were from the actual predictions. Third, the NetflixPrize used it.
In order to determine the amount of success, we used a control algorithm. The control algorithm - that is, the most basic prediction method - is simply using the global average for an item as the predicted value. This is a simple algorithm, so it is important to us to perform better than it.
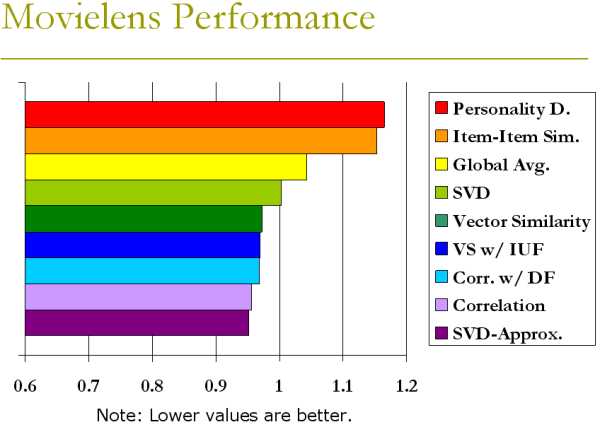
MovieLens Performance
The Movielens dataset was easy to test on. It was relatively small (with only 100,000 entries) and already had two test sets created, ua and ub. The results below are for the ua dataset.
Ultimately most of our algorithms performed well. The two that performed worse than global average did so based upon difficulty working with such a small, sparse dataset.
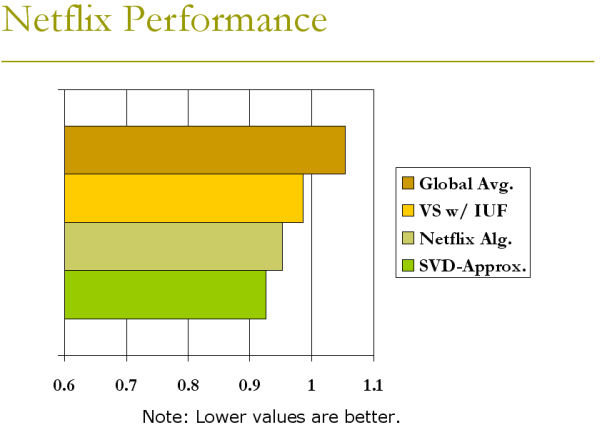
Netflix Performance
The NetflixPrize dataset was absolutely gigantic, with 100 million entries. Also, their testing set had 2 million predictions they wanted. Thus, we only had time to try out two algorithms on the data.
Of the two we tried, both performed better than global average. One performed almost as well as the Netflix algorithm, and one performed better.
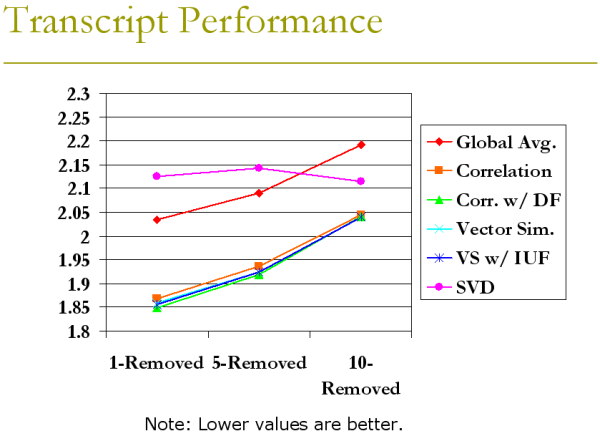
Transcript Performance
The transcript dataset was small (about 130,000 entries) and extremely sparse. Also, we had to create our own test sets for the transcript data. For our purposes, we tried testing it when a number of items have been removed from each student - one course, five courses, and ten courses.
In most cases we performed better than average. Also, our algorithms managed to stay on top even with less data. The odd-man out is SVDs, which for some reason performed worst on more data but better on less. We did not have time to optimize SVDs, however, so such erratic behavior is to be expected.
Before reading the actual numbers, take note that we had to convert grades to a number scale from 1-12, where 1 is an F and 12 is an A. We had to do this because our algorithms and RMSE testing only work for numbers.
Perturbed Transcript Performance
One method we came up for to protect privacy was data perturbation. But how well would the algorithms perform with perturbed data? In order to answer this we tried perturbing the data from the 1-item removed training set to see how well our algorithms held up. The amount of perturbation is simply the standard deviation of the Gaussian distribution from which we draw our random perturbations.
Overall we had great success with perturbed data. A standard deviation of under 3 seemed to still perform relatively well, which is surprising since it means that each grade could potentially change wildly.