FollowTheMoney

Visualizing the Connections Between U.S. Congress Members' Funding and Speech

Project Overview

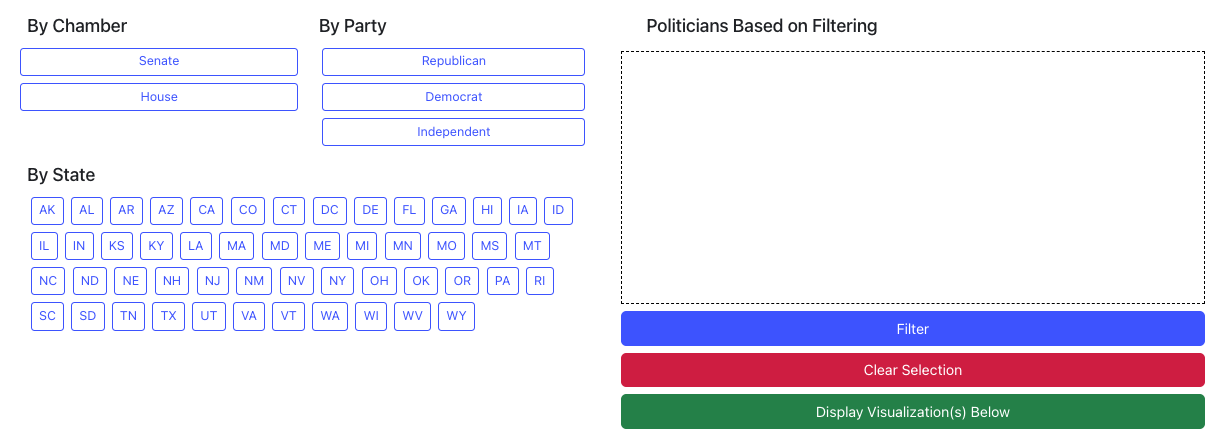
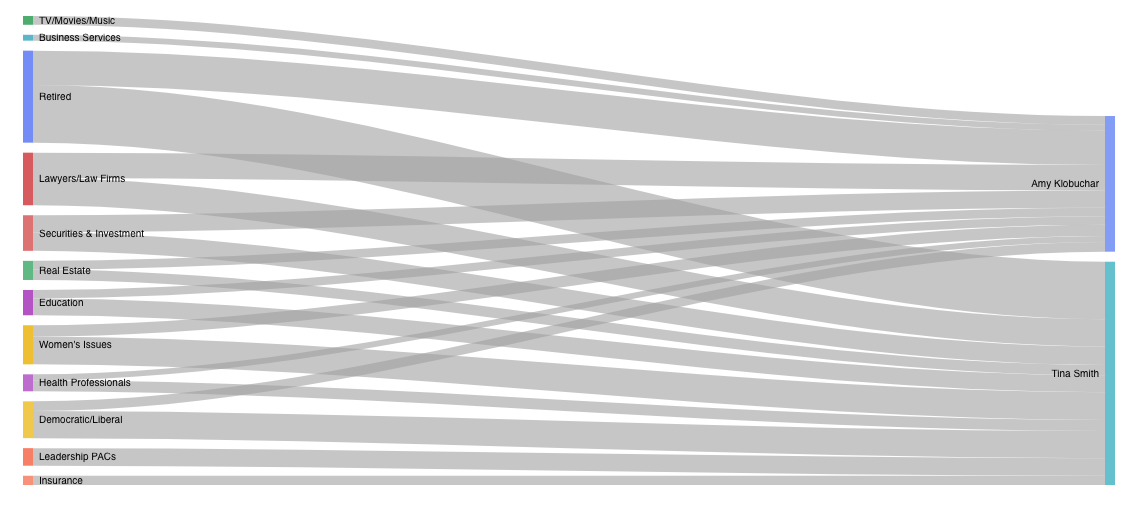
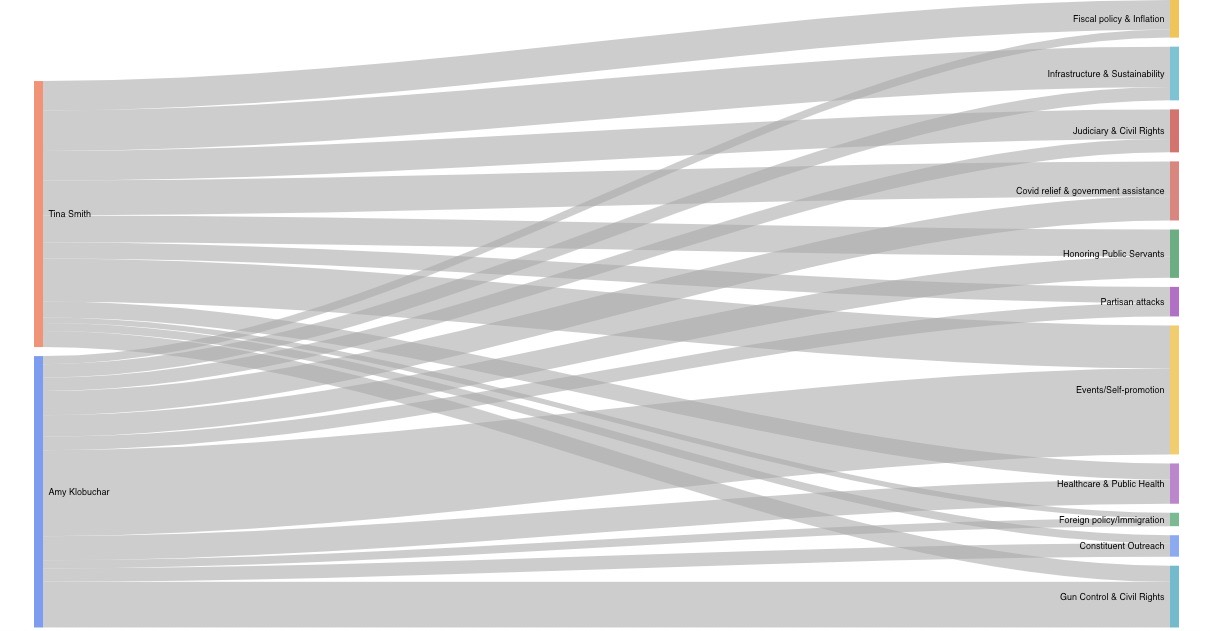
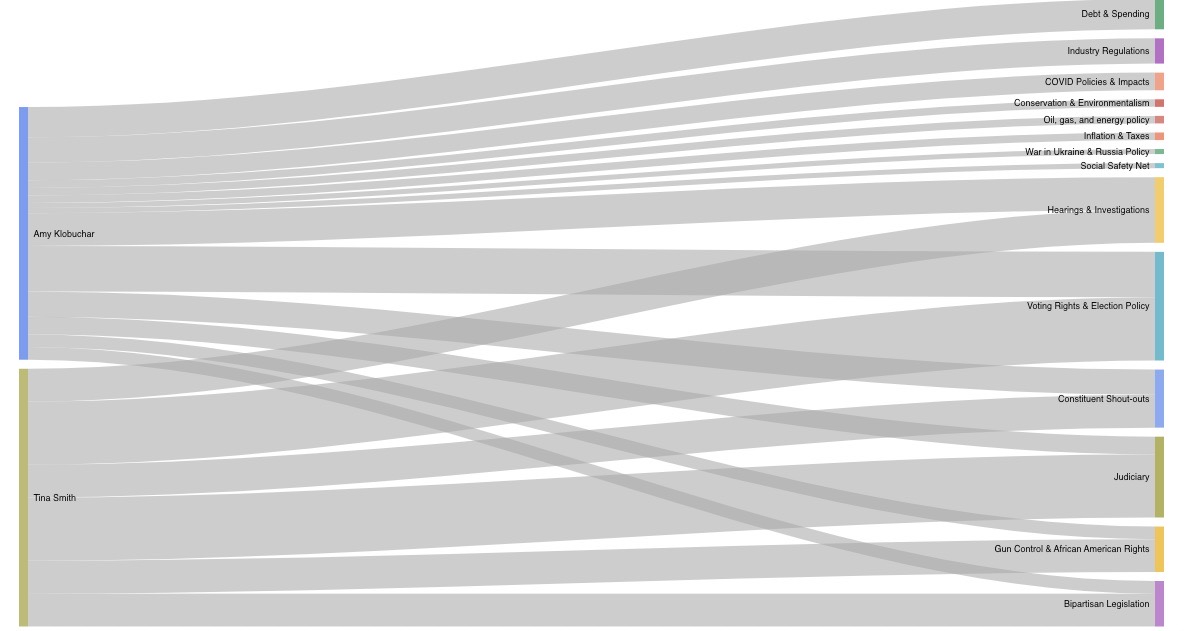
FollowTheMoney is a web application that enables exploration of the relationships between funding sources and speech topics for members of the 117th United States Congress. These relationships are visualized in the form of Sankey diagrams, which the flows of money from donating industries to congresspeople and the flows of speech from congress people to topics. FollowTheMoney uses data on campaign funding broken down by industry gathered from OpenSecrets, statements made on the floor of Congress collected from the Congressional Records, and tweets for each congress person pulled from Twitter. To extract and quantify the topics contained in the statements and tweets, we used a Latent Dirichlet Allocation (LDA) topic model, assigning each document to a particular topic. We hope that FollowTheMoney's intuitive, simple interface can help a broad audience understand better how campaign contributions influence what politicians talk about.

Project Workflow

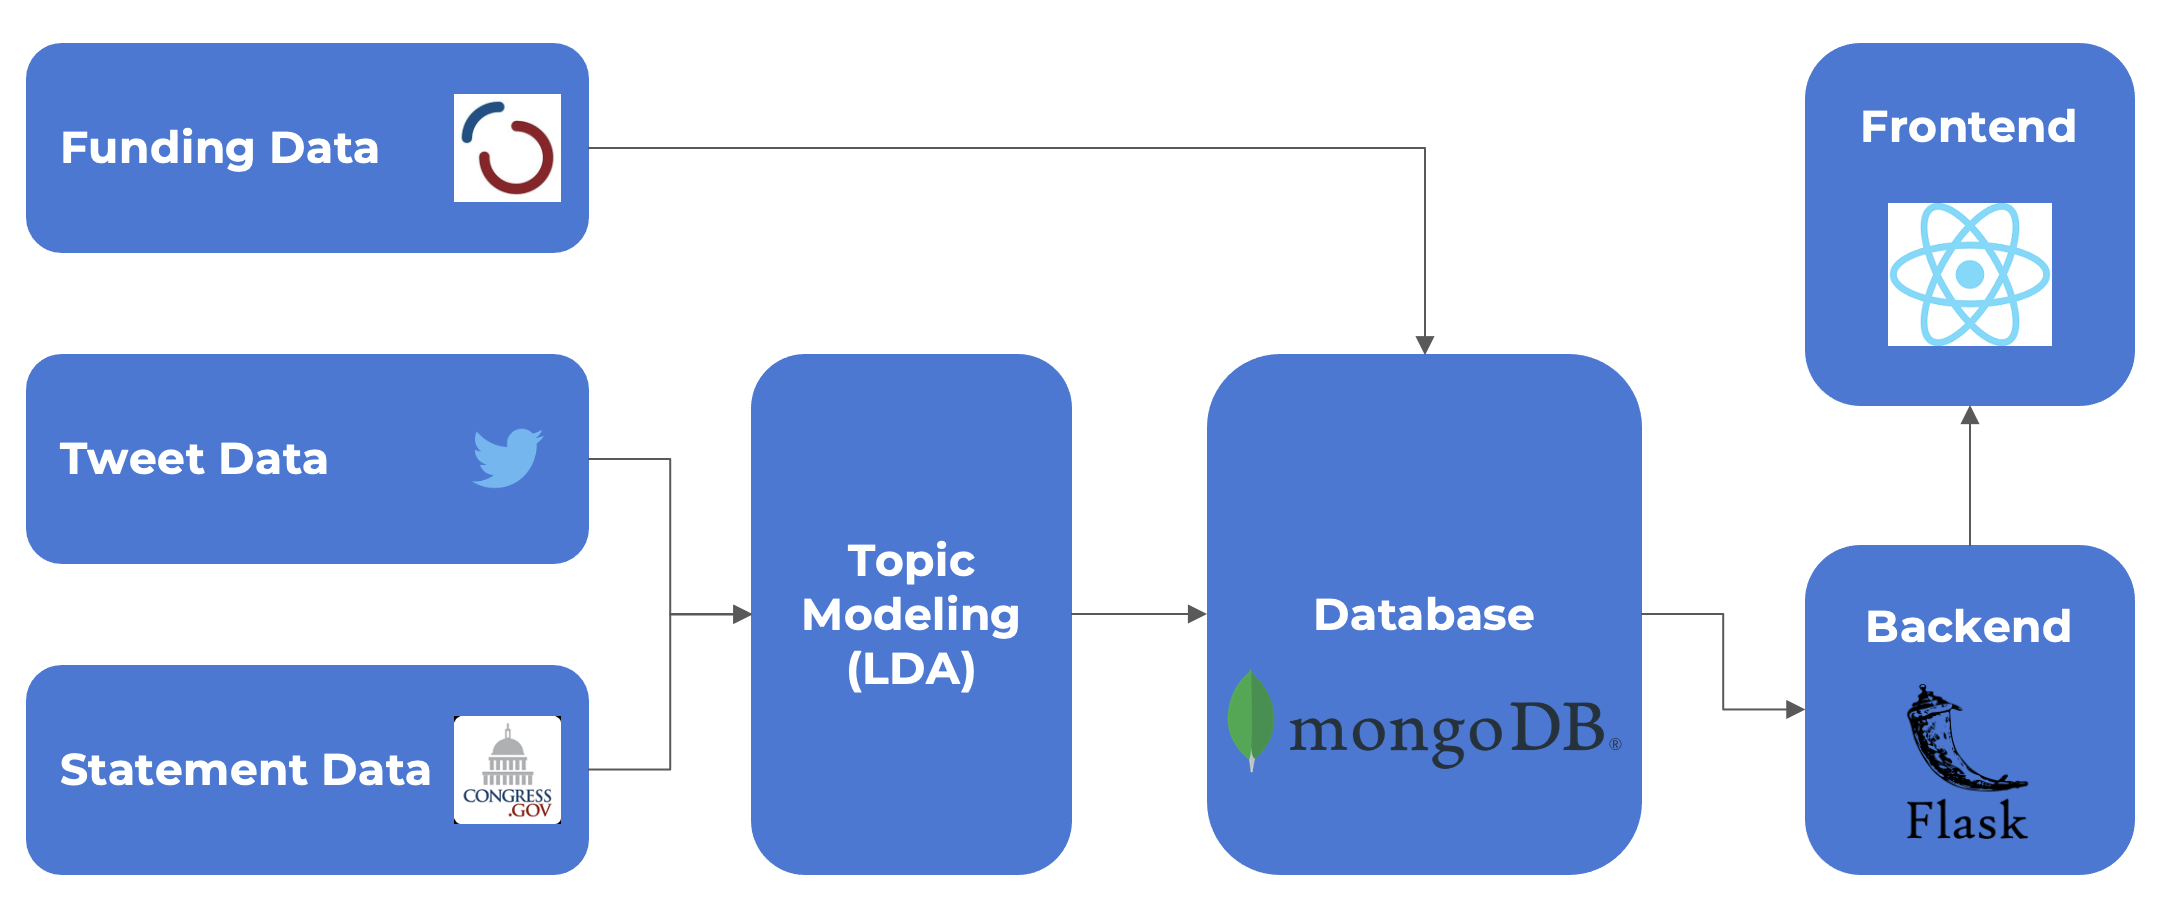
Figure 1: Project Workflow


How It Works

Users are able to input an arbitrary subset of congresspeople by using the filtering system below:

Filtering Sytem

Upon clicking "Display Visualization(s) Below", three visualizations will be displayed:

  • A Sankey diagram showing the breakdown of the top 10 industries that fund the congressperson(s).
  • A Sankey diagram showing the breakdown of the distribution of the topics found in the congressperson(s) Tweets.
  • A Sankey diagram showing the breakdown of the distribution of the topics found in the congressperson(s) congressional statements.

See examples of those diagrams below for the Democratic Senators of Minnesota (as of March 2023):

Visualization of Funding

Figure 2: Diagram Representing of Funding From Top 10 Industries

Visualization of Tweet Data

Figure 3: Diagram Representing of Top 10 Tweet Topics

Visualization of Statement Data

Figure 4: Diagram Representing of Top 10 Statement Topics


Methods

Funding data was collected from the OpenSecrets API. This data consists of the contributions to each congressperson in the 117th Congress from the top ten contributing industries for that congressperson, based on contributions made in the 2020 election cycle. OpenSecrets groups contributions into 83 industries, and the dollar amounts displayed in our Funding visualization reflect the total contributions from all individuals, corporations, or PACs affiliated with the specified industry to the given congressperson.

Tweet data was collected from the Twitter API. We collected all available Tweets for each congressperson with a public Twitter account in the 117th Congress. To extract the topic categories displayed in our visualizations, we fit a Latent Dirichlet Allocation (LDA) statistical language model to a subset of the Tweets consisting of one hundred randomly selected Tweets for each congressperson. For each Tweet in this subset, the LDA model assigned probabilities that the Tweet was about one of our twelve topics. We labeled the topics by manually examining the tweets that were assigned high probabilities and gleaning their topics. The proportions displayed in the Tweets visualization are calculated as follows:

  • For topic X, count the number of Tweets where the highest probability is assigned to topic X and that probability is at least 0.15 (a threshold we set after manually inspecting the coherence of topics with decreasing probability).
  • Divide this number by the total number of Tweets that assigned at least 0.15 probability to some topic.

Statement data was collected from the Congressional Record API and consists of statements made by congress people during the 117th Congress on the House or Senate floors. Like the Tweet data, we intuited the statement topics by fitting a LDA model to the statement data; unlike the Tweet data, we categorized the statements into twenty-five topics. We followed the same manual procedure to label the statement topics, and determined a classification threshold of 0.2 using the same inspection procedure we used to find the 0.15 threshold for the Tweet data. The proportions displayed in the Statements visualization are calculated similarly to the proportions in the Tweets visualization.


Demo


Download our Presentation


About Us!

Kevin Chen

usa.kevin@gmail.com

LinkedIn Profile
Picture of Kevin


Kevin is a Computer Science and Statistics major from Normal, IL. He is a member of Carleton's swim team and also enjoys playing the piano, photography, and travel. His primary academic interests are in backend engineering, data science, and machine learning. Post-graduation, he'll be joining Veeva Systems as a Software Engineer in San Francisco.

Lita Theng

laklitatheng@gmail.com

LinkedIn Profile
Picture of Lita


Lucklita Theng, Lita, is from Phnom Penh, Cambodia, and is passionate about how technology can be used to empower people to do good. In her free time, she enjoys horse riding, reading, and doing digital illustrations. After graduation, Lita will be leading a Davis Peace Project called ARC (Artists for a Reconciled Cambodia) where she'll be collaborating with different organizations in Cambodia to create a database of Cambodian artists and build a virtual gallery room to exhibit their works online.

Ben Aoki-Sherwood

aokisherwoodb@gmail.com

LinkedIn Profile
Picture of Ben


Ben is from Robbinsdale, Minnesota, and is a member of the cross country and track and field teams at Carleton. Outside of the classroom, he enjoys playing the cello and doing anything outdoors, especially biking, hiking, and playing frisbee. After graduation, Ben will be joining The Johns Hopkins Applied Physics Lab in Laurel, MD as an Algorithm Developer, where he hopes to start a career in applied math/data science.

Anna Neiman-Golden

aneimangolden@gmail.com

LinkedIn Profile
Picture of Anna


Anna is from New York City, and is a diver at Carleton. Outside of class, she enjoys dancing, doing gymnastics, and arts and crafts. Anna wants to use her computer science education to help improve the healthcare system, and after graduation she hopes to get a job as a software engineer or computational biologist for a healthcare non-profit.

Chisomnazu Oguh

chisomoguh@gmail.com

LinkedIn Profile
Picture of Chisomnazu


From Little Rock, Arkansas, Chisomnazu is a Computer Science major at Carleton College. She enjoys dancing, listening to music, and watching commentary YouTube videos. She is interested in learning more about the EdTech space and front-end developement. After graduation, Chisomnazu hopes to study abroad and teach English in another country and use that experience to discover the many different ways that technology can enhance education.

David Chu

davidchu11381@gmail.com

LinkedIn Profile
Picture of David


David Chu is from Ho Chi Minh City, Vietnam. He is a Computer Science and Statistics double major, and he enjoys playing tennis and watching tv shows. Post graduation, he plans to pursue a PhD in Information Science.

Source Code

Visit our GitHub repository to view our code and documentation