Drawing Inferences from iOS Location Data is a look into what might be behind the scenes of real-world iOS location-tracking applications. Our app implements a Carleton campus-specific statistical model that converts a local database of user locations into inferences. The UI will display inferences about where a user lives/works and what their class schedule/routine might be. An interactive map will show past location history on an optional heatmap. By narrowing our statistical model to the Carleton campus, we begin to explore what a malicious app can determine with location data.
Drawing Inferences from iOS Location Data is a look into what might be behind the scenes of real-world iOS location-tracking applications. Our app implements a Carleton campus-specific statistical model that converts a local database of user locations into inferences. The UI displays inferences about where a user lives and frequented locations. By narrowing our statistical model to the Carleton campus, we begin to explore what a malicious app can determine with location data. Safety apps like Life360 have been found to have malicious practices of storing and selling location data. Even anonymized data isn’t safe; with enough data, a routine made from location data can be used to track a person and find you. Our goal is to show how this can be done and how simple it can be, too.
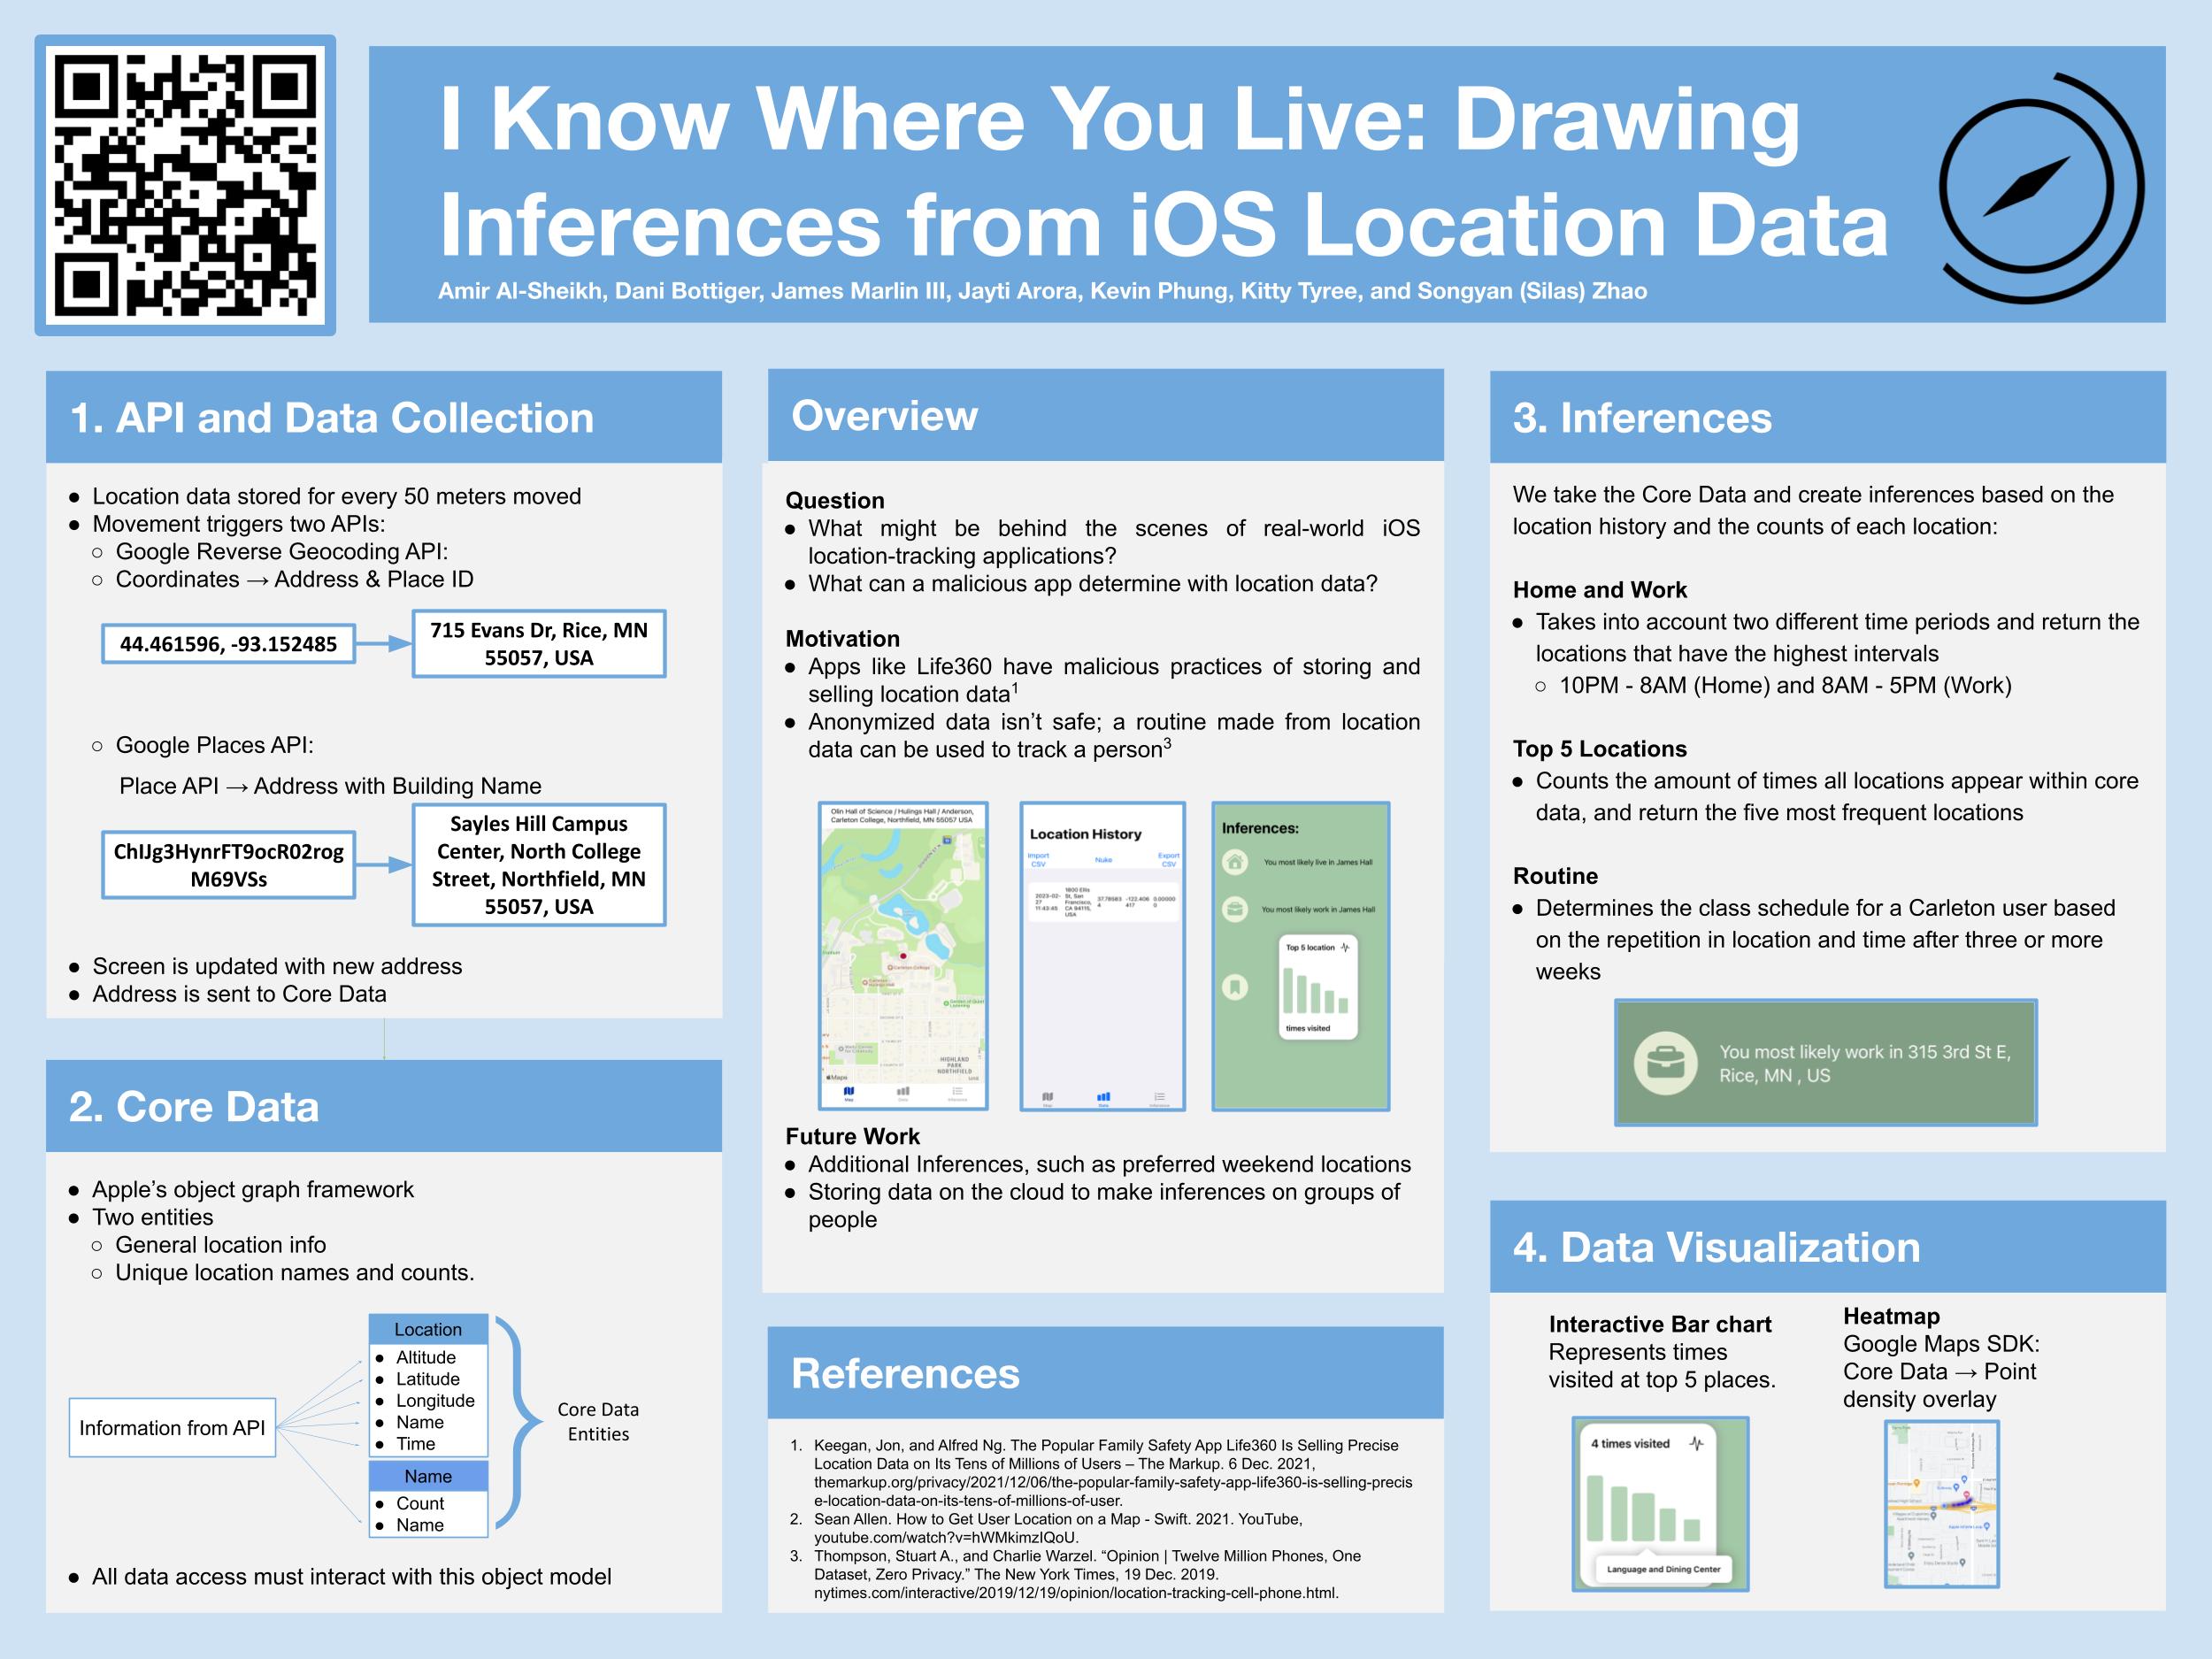
Our iOS application uses a Location Manager to get location data as coordinates. With coordinates, we can display your location on the screen, but without human-readable information, we can’t determine much else. We used the Google Maps API to reverse geocode the coordinates into an address. When an address has a name associated with it, such as a college building, we use the Google Places API in addition to pull this special name. This name and address are then displayed on the map view. When the user moves 50 meters, the Location Manager triggers multiple functions. These functions collect the coordinates, reverse geocode the coordinates into an address, update the address on the screen, and send the information to Core Data.
We used Core Data as it is natively supported by iOS and provides a framework for managing all data as an object graph, where each data entry is stored as an object. Under the hood, it uses SQLite for persistent storage. To retrieve data, we use ‘fetch requests’ which are equivalent to “SELECT” queries in SQL. Using this model, we were able to implement importing and exporting the location log as well. We created two entities, one for general logging and another for storing unique Location Names andtheir associated counts. The reason for using dual entities was for optimization purposes wheninferences were made
We take the Core Data and create inferences based on the location history and the counts of each location:
Home and Work
These inferences take into account two different time periods and return the locations that have the highest intervals within the time period of 10PM - 8AM(Home) and 8AM - 5PM(Work).
Top 5 Locations
Counts the amount of times all locations appear within core data, and return the five most frequent locations.
Routine
This algorithm determines the class schedule for a Carleton user based on the repetition in location and time. After a set duration of three or more weeks, the algorithm will recognize the pattern and display to the user their schedule for the Weekday.