About
This product was built by 5 senior CS students at Carleton College: Aiden Chang, Anders Shenholm, Jeylan Jones, Luke Mager, and Shaun Baron-Furuyama. Our goal was to design a system for determining which websites are present in a network traffic trace. After taking and examining many network traces, we concluded that IP addresses would be the most reliable and broadly-applicable indicator for websites we want to profile. Our project offers insight into how a malicious actor (i.e. person-in-the-middle) could gather information about one's online activity even from encrypted network traffic. We also hope that it's a fun, accessible tool that people can use to learn about the internet.
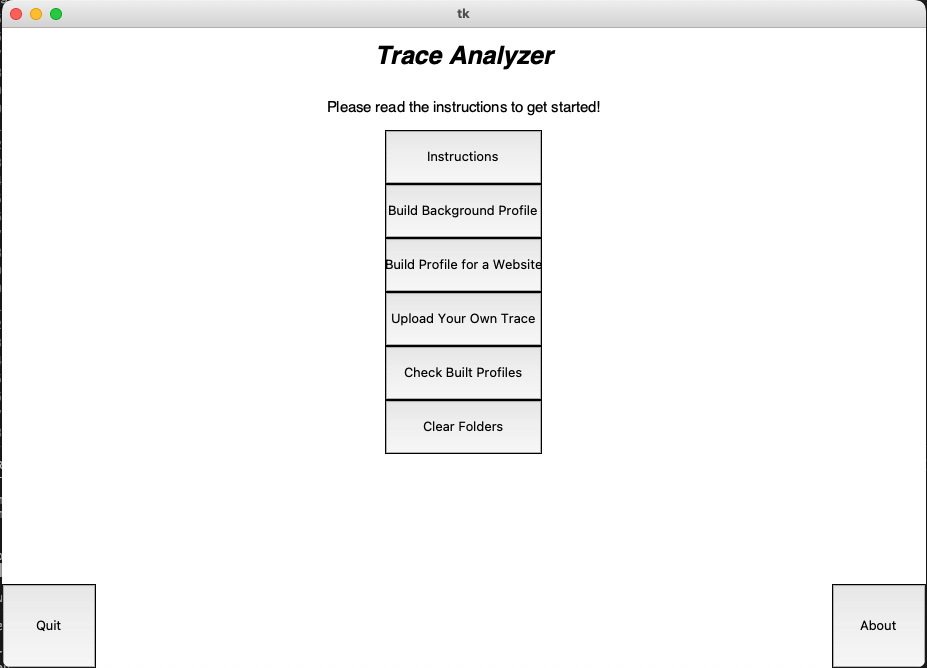
Basic User Workflow
Closing all tabs:
After launching the GUI, the first thing the user should do is read the instructions. The instructions will instruct you to shut down all processes excluding the GUI running on your device (this includes background processes like bluetooth and vpn).
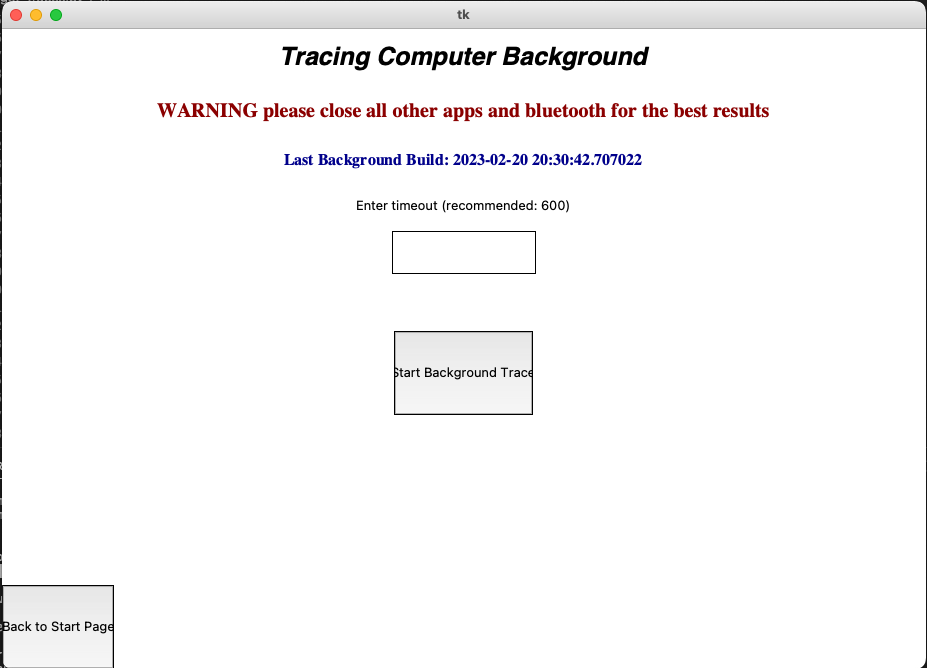
Profiling Background:
The first thing the user should do after is to profile their background. When we are profiling applications, we build a profile by monitoring the ip addresses we detect on the users computer. To create an accurate background profile, we need the traces to be as clean as possible. The user can choose the timeout by typing it in the white box (the default is 600). The user will not be able to access any other workflow before they have a background profile. This process should take around 10 minutes.
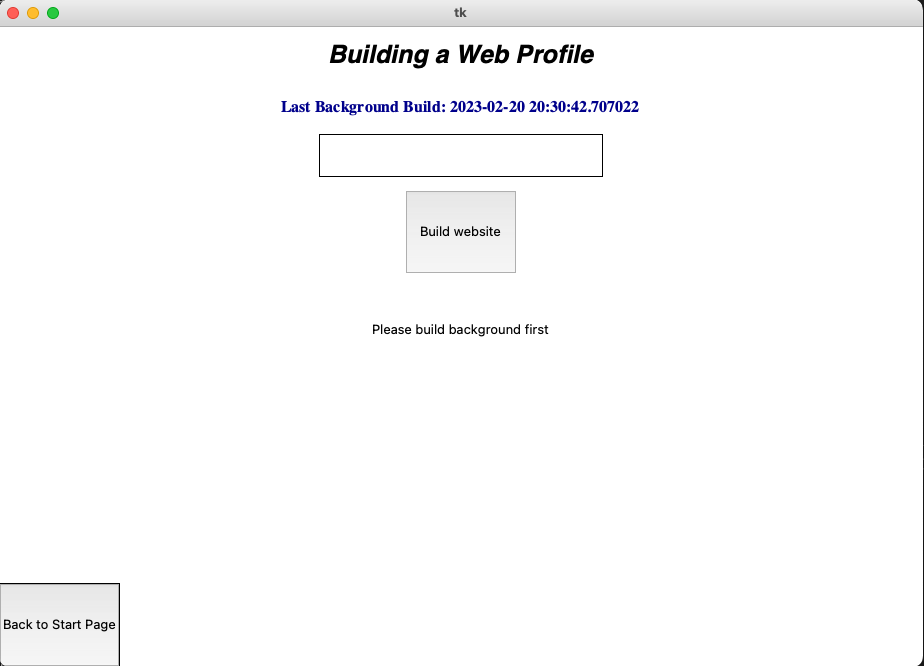
Profiling a Website:
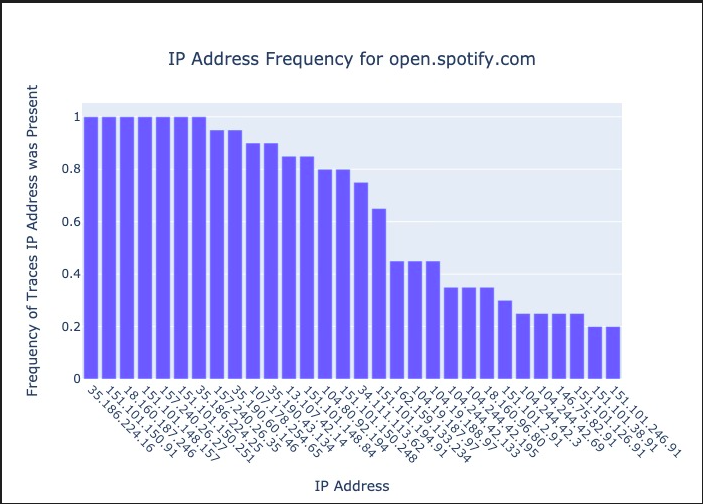
Once the background Profile is made, the user can profile a website. Simply type in the website name (ex: https://www.open.spotify.com) and the program should start profiling the website. Once done, the program will save a profile of the website in your /ip_profiles folder. It will also build a graph in the /bar_charts folder.
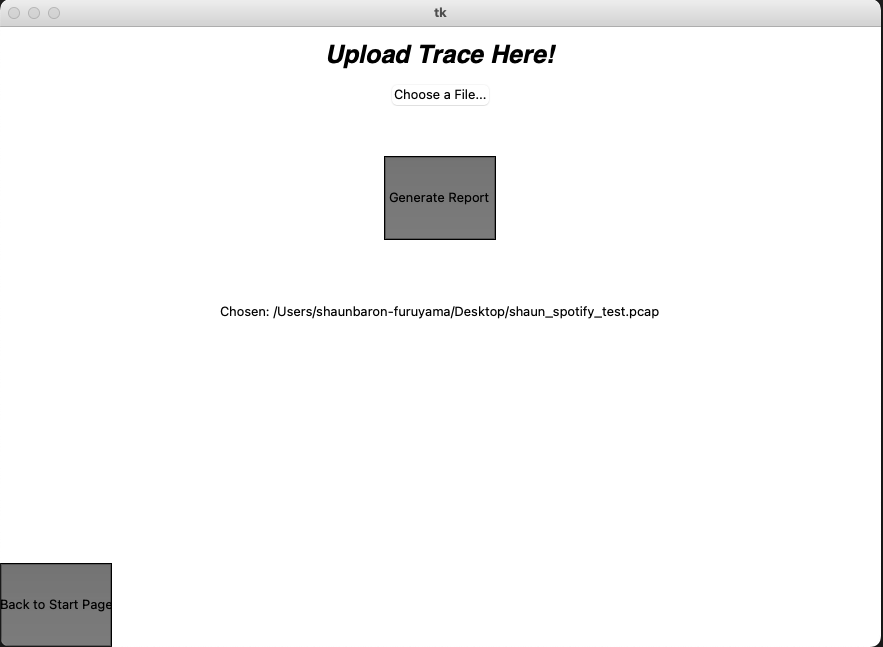
Uploading Your Own Trace:
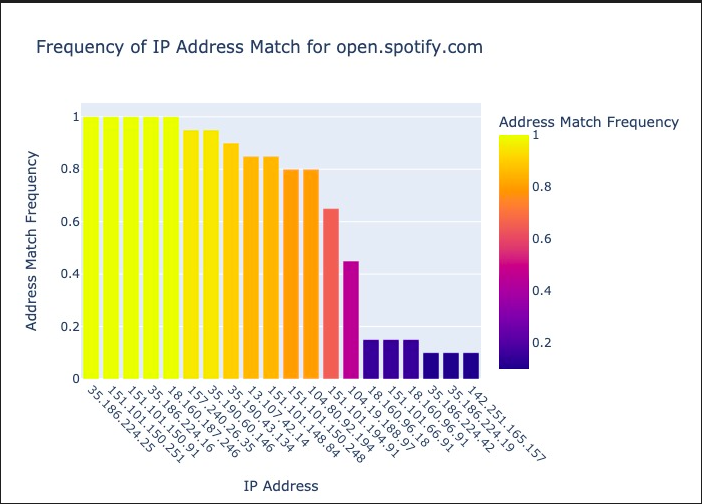
You can upload your own noisy trace to compare it to the built profiles. The uploaded trace must be a .pcap file. After hitting the 'generate profile' button, the program will generate a text file report in the directory of this code as full_report.txt. The code will also generate graph reports in /match_graphs.
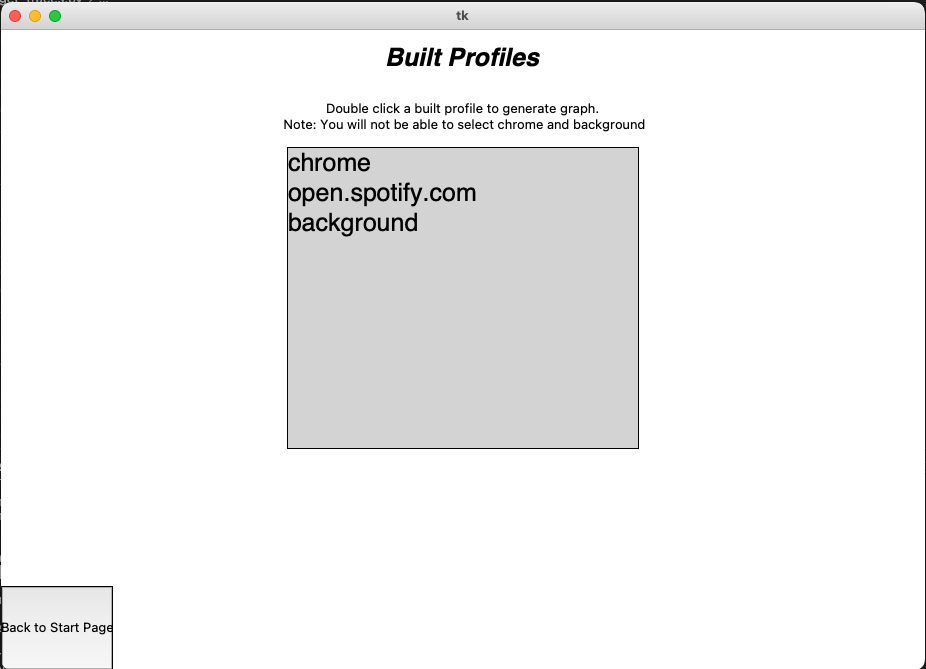
View your built profiles:
After hitting the 'generate profile' button, the program will generate a text file report in the directory of this code as full_report.txt. The code will also generate graph reports in /match_graphs.