Summary
Goals

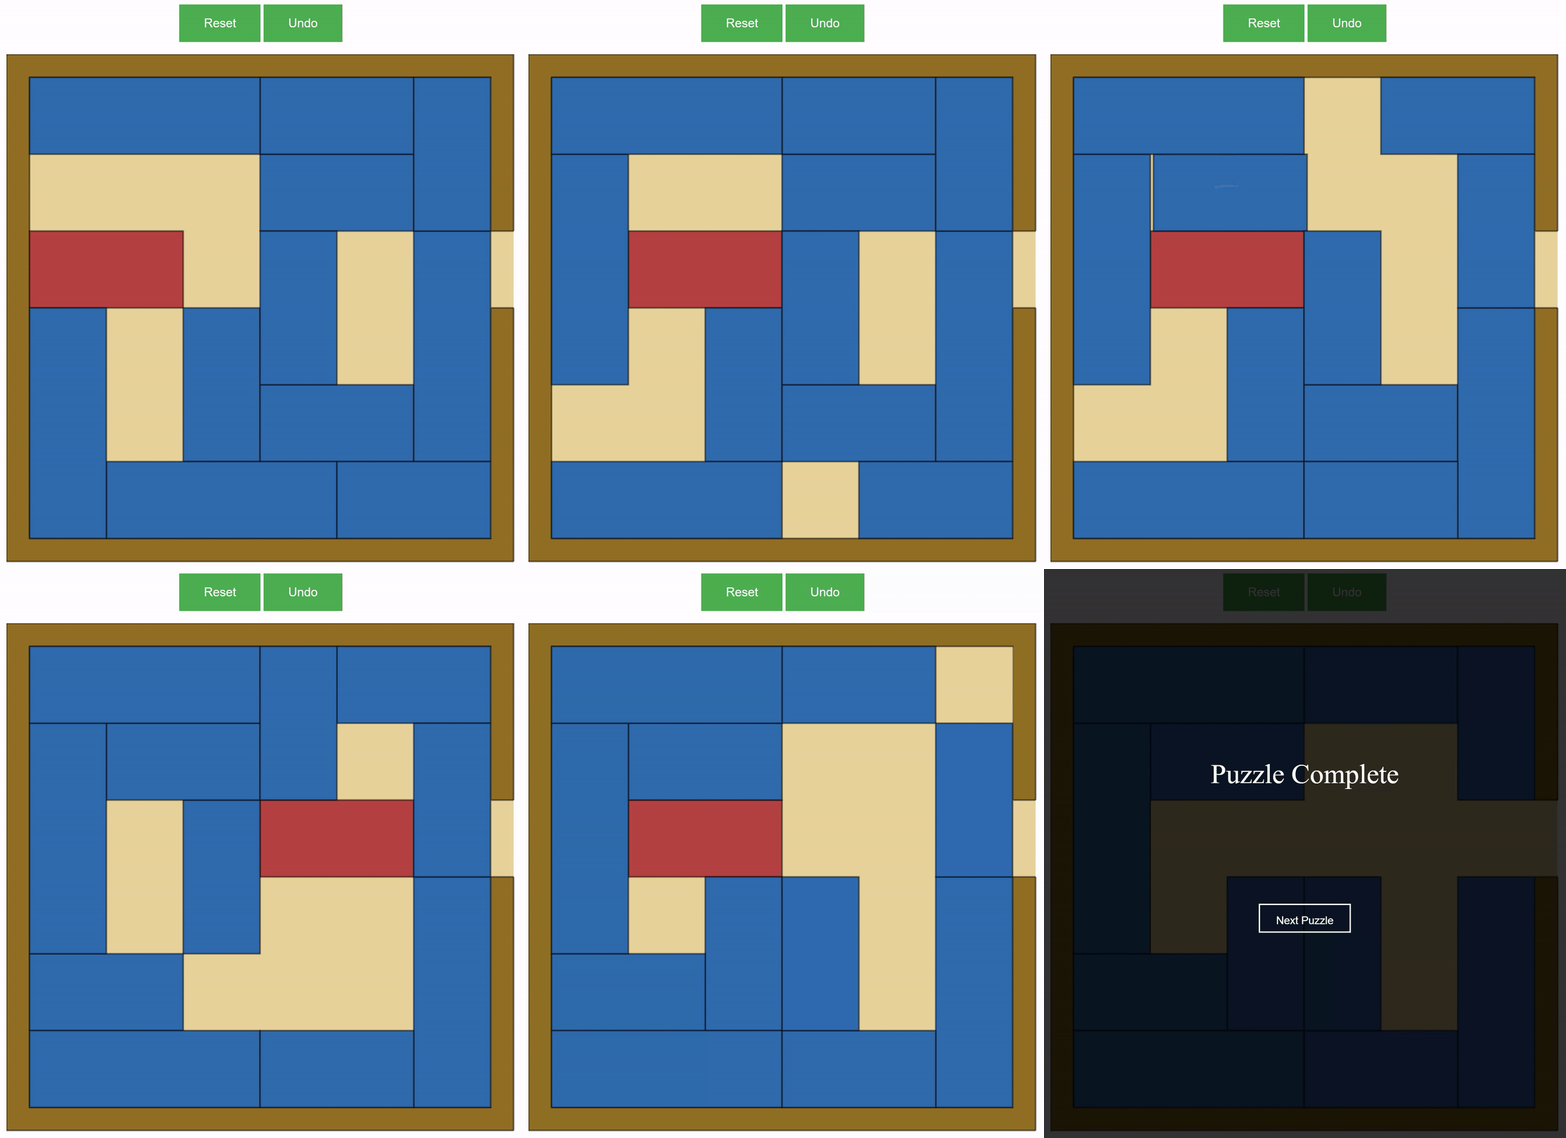
Our project was about creating a Personal Puzzle Producer. We decided to focus on Rush Hour as our puzzle of choice, due to the fact that it was not at widely studied as other puzzles of a similar difficulty, but was also not so complicated that we would not be able to properly investigate it.
We wanted to implement a version of the game which adapted to an individual player's skill level. To do this, we planned to generate a large quantity of puzzles of varying difficulty, gather the data of a variety of users, analyze it, and then develop a prediction model which would adapt to players.
Generation
Our puzzle generation was done through a relatively naive algorithm. It involved randomly placing the VIP car in an unsolved location, and then randomly generating blue cars to fill the rest of the board. Our generation algorithm functioned under two main parameters: number of cars and the minimum number of moves required to solve the puzzle.
It turned out that puzzles with a minimum number of moves over 30 were very rare and hard to generate. We developed a ‘walkback’ function that would allow us to travel from a randomly generated instance of a puzzle, to the furthest possible state from a solution. Integrated with the random generation, this was our final algorithm for our project.
Solver
For solving puzzles, we found that a simple breadth first search of the entirety of the state space was sufficient. It turns out that the longest path from the starting state to a solved state for any instance of the Rush Hour puzzle was a path of 93 states. Breadth first search was able to solve this with unoptimized code and modern computing power in under a second. However, it was noticed that solving times increased drastically if the board size was increased to a 7x7 board. Since performance was good in normal case and we did not need a fast solver for our final product, we did not pursue finding a more efficient algorithm using the context of the puzzle.
Data
To assess how players actually performed on our puzzles, we decided to first collect empirical data using Amazon’s Mechanical Turk service, which allowed us to pay many users to solve puzzles. We set up a web app that allowed Mechanical Turk users to play 100 pre-generated instances of Rush Hour of varying minimum moves to solution. While users solved puzzles, we maintained a solve log containing time stamps and all the actions they took for that solve to use in data analysis. In total, we ended up with around 1200 solve logs.
Although the data we collected allowed us to build a decent model for how hard a given user would find a puzzle, we would have liked to collect more data points per puzzle. If we were to run this again, we would track individual users throughout multiple solves as well as qualitative data to determine how fun each puzzle was.
Puzzle Evaluation
Our goal was to make a predictor that could look at puzzles and tell you how difficult they would be for humans. To this end, we had to have some features of a given puzzle that we could correlate with the data collected from Amazon’s Mechanical Turk. We created scripts that could evaluate how difficult puzzles were based on a number of features: minimum number of moves to solve, average possible moves in any given state, and weighted walk length. This last feature takes a random walk, but weights moves that are closer to the solution more heavily, especially as the distance to the solution decreases.
Analysis
In order to make our predictor we had to see what features of a puzzle made it difficult for humans to solve. To do this, we looked at the correlations between our Mechanical Turk data and puzzle evaluation of the 100 puzzles we ran. We found that the best correlation was the number of moves the user made and the weighted walk length of the puzzle.
Prediction Model
The predictor was the star of our webapp. Briefly, its job is to choose an appropriate next puzzle for the user given a history of previous solves. This is done by computing the user’s most likely true skill, and then choosing a puzzle that will be most appropriate for them given that true skill. Fixing a true skill, we expected that the graph of solve difficulty vs. puzzle difficulty will model a Sigmoid curve, and that the likelihood of this estimate being correct follows a normal distribution. Then, we use Maximum Likelihood Estimation to choose the true skill with the highest probability of predicting the user’s solves so far.
Nonograms

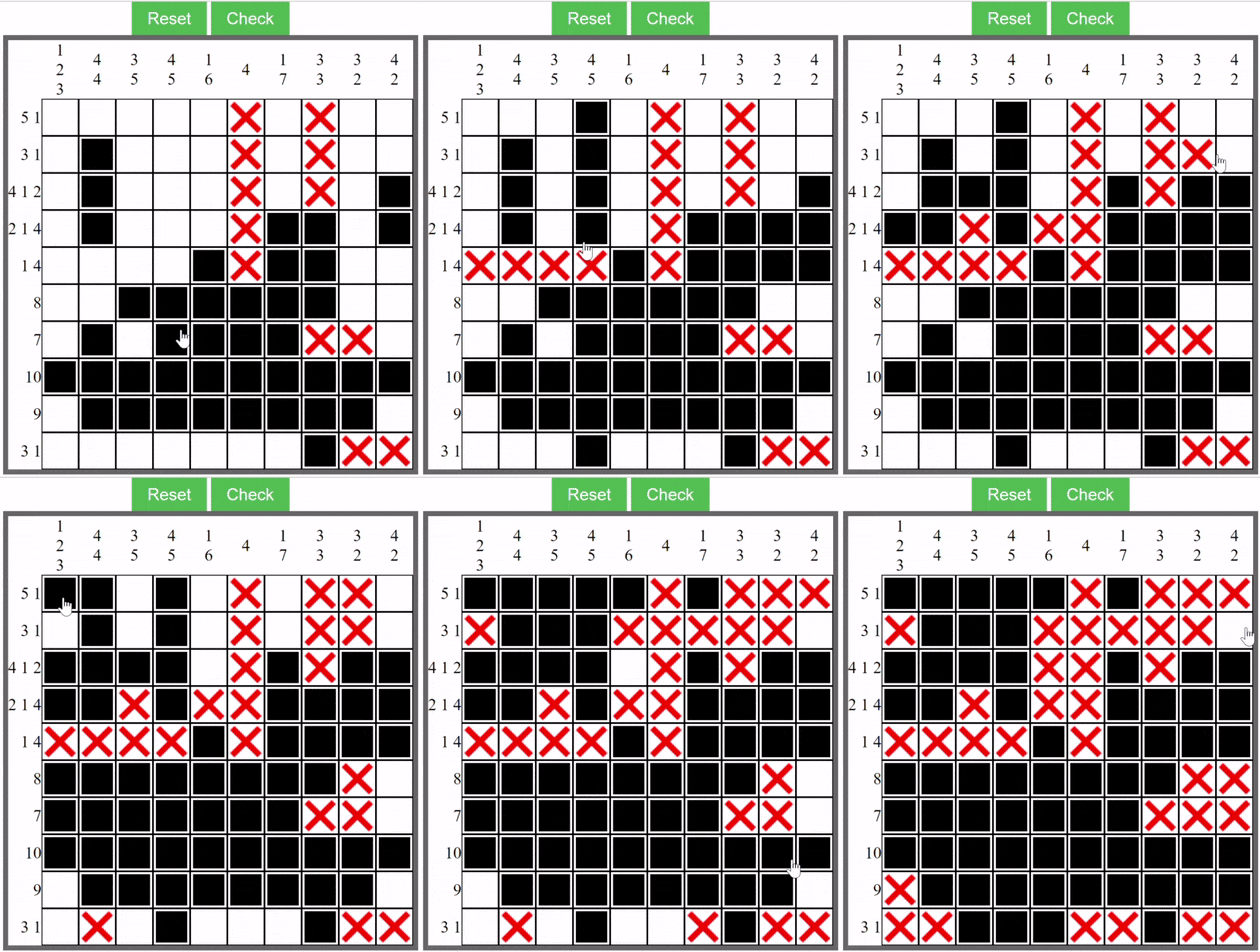
Our original goal was to automate choosing puzzles. We decided to show that our method for making a personal puzzle producer for Rush Hour could be extended to other games by following the same methods to create a personal puzzle producer for Nonograms. Nonograms is an NxN board with clues that tell you which squares to fill in. For example, on a 5x5 board, the clue “2 2” on a row tells you that you must fill in 2 squares, have at least one blank square, then fill in two more.
For generating boards, we started with an empty NxN board, then filled in squares randomly. We then applied a Game of Life-style step to make the filled in squares appear in more contiguous blocks, which creates puzzles that are more fun. Once we have the solved board, we fill in the clues. To solve these puzzles, we just try all permutations of valid rows. This can get slow for larger puzzles, so we implemented a human-like step that fills in any squares that must be filled in for every valid permutation of filled in squares for a given row or column. To evaluate how difficult a given puzzle is, we used how close the ratio of filled in squares in the solved puzzle is to ½.
We didn’t have the time or monetary resources to run a number of puzzles on Amazon’s Mechanical Turk, so we just used the predictor model that we developed for Rush Hour. Since this was just a proof of concept, it was acceptable to use a model with non-optimized constants. With additional information, we could find the correct constants to make our model correctly adapt to players’ abilities. In order to analyze players’ solving ability, we just used the time taken on the puzzle. In our experience, the model results in puzzles that are a bit too easy for the solver.
Conclusion
We spent a lot of time developing our tool, and we made a tool that produces fun puzzles. This description is fairly brief, so if you’re interested, we encourage you to check out the code.